
Website cache troubleshooting is the process of checking whether caching is genuinely making pages faster—or causing stale content, inconsistent behaviour, and false confidence about performance. A cache can reduce work for the server, but it cannot repair a slow database query, overloaded hosting account, inefficient PHP code, or a page that should not be cached in the first place.
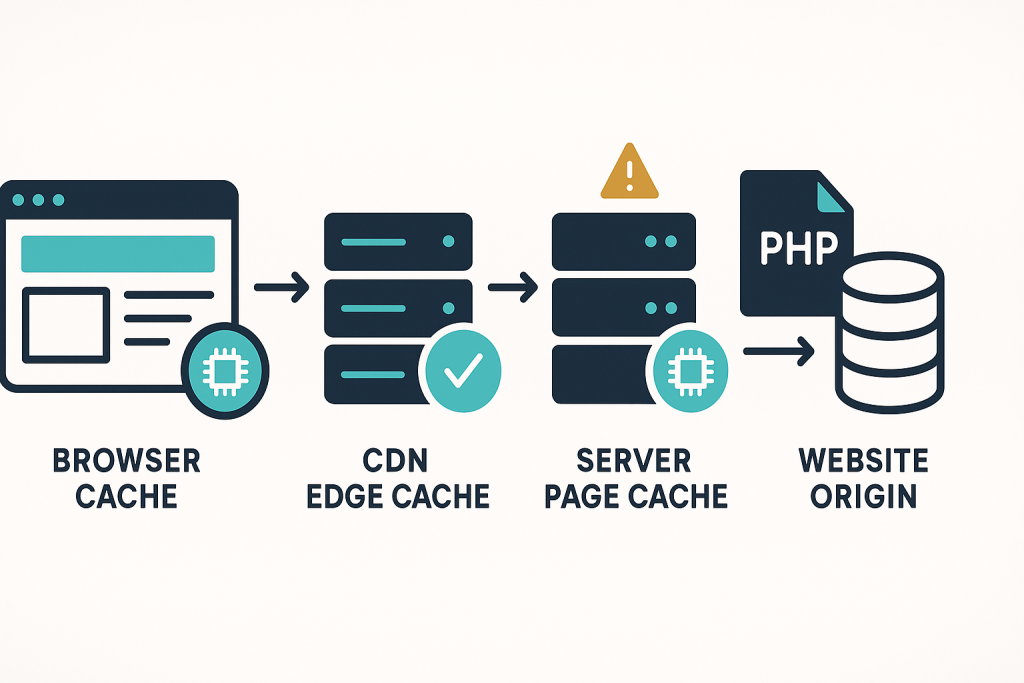
The goal is not simply to turn on every available cache setting. The goal is to understand what is being cached, where it is cached, who receives the cached response, and what happens when the cache is bypassed. For a broader review of page delivery, server response, and frontend loading, see Website Performance Optimization.
What website cache troubleshooting actually checks
A visitor may interact with several cache layers before a request reaches your application:
- Browser cache stores assets such as images, stylesheets, JavaScript, and fonts on an individual device.
- CDN or edge cache stores responses close to visitors, often serving public pages without contacting the origin server.
- Server page cache stores generated HTML so PHP and the database do less work for repeat requests.
- Object cache stores reusable application data, such as expensive query results or settings, in memory.
- Opcode cache keeps compiled PHP code available so it does not need to be parsed on every request.
These layers solve different problems. A strong browser cache may make repeat visits feel fast while first-time visitors still wait on a slow server. A CDN may serve the homepage quickly while product, search, account, or checkout pages remain slow. Object caching may reduce database work but have no visible benefit if the largest delay comes from unoptimized images or blocking scripts.
Common signs that caching is involved
Caching is worth investigating when the behaviour is inconsistent rather than consistently slow. Typical signs include:
- A change is visible to some visitors but not others.
- The site looks correct in an incognito window but wrong when you are logged in.
- One URL is fast on a second load but slow after a hard refresh or from another location.
- New prices, stock levels, banners, or published content appear late.
- Cart totals, account data, or other personalized content appears where it should not.
- A purge appears to work briefly, then old content returns.
- Performance tools report a good score, but real visitors still report slow pages.
None of these symptoms proves that the cache is at fault. They indicate that you need controlled comparisons. Avoid treating a single test from your own browser as conclusive evidence.
Start by defining the affected page type
Before changing settings, classify the page. Public, mostly static pages—such as a homepage, article, landing page, or service page—are usually suitable for full-page caching. Dynamic pages need more care. Product availability, filtered search results, account areas, contact forms with security tokens, carts, checkout pages, and personalized dashboards may require exclusions or carefully designed partial caching.
Write down three things:
- The exact URL and symptom. For example, “the homepage shows yesterday’s banner” is more useful than “the cache is broken.”
- The affected audience. Is it every visitor, logged-out visitors, logged-in users, customers with a cart, or only a particular location?
- The expected freshness. A marketing page may safely refresh every hour; stock, payment, or account data may need much faster invalidation or no full-page cache at all.
This classification prevents a common mistake: disabling all caching because a page with personal data was cached incorrectly. The correct fix may be one exclusion rule, not the removal of a useful performance layer across the entire site.
Compare cached and uncached responses safely
Use repeatable tests. Check the same public URL in a private browser window, then test again after clearing only the relevant site data or using another network. If you have access to response headers, look for cache-status information added by the CDN, host, or caching software. Labels vary, but they often indicate a cache hit, miss, bypass, or revalidation.
Compare:
- First request versus repeat request: a substantially faster repeat request may indicate a working page or edge cache.
- Logged-out versus logged-in: logged-in visitors are commonly excluded from page cache for safety, so their experience can reveal origin performance.
- Cached URL versus a deliberate cache bypass: do this only when you understand the platform’s safe test method. Random query strings can create duplicate cache entries or fail to bypass the relevant layer.
- Different locations or devices: edge cache behaviour, browser cache, and routing can differ by visitor.
Record the time to first byte separately from the total page load time. A fast cached HTML response with a slow visual load usually points to frontend assets, third-party scripts, fonts, images, or render-blocking resources. A slow uncached response often points farther upstream to PHP execution, database work, external API calls, or server capacity.
Find the cache layer that owns the stale content
When content remains old after an edit, purging only one layer may not be enough. The browser may hold an asset, the CDN may hold the HTML, and the origin page cache may still contain the previous response. A cache plugin’s “clear cache” button may only clear its own store; it may not invalidate the host or CDN cache.
Work from the visitor inward:
- Confirm whether the affected item is HTML, an image, a stylesheet, JavaScript, or API data.
- Check whether the old result appears in a private session and from a second device. This helps distinguish browser storage from shared cache.
- Verify whether the CDN or hosting layer is still serving an older response.
- Check the application cache’s purge or invalidation process.
- Confirm that the edit actually reached the live origin and was not blocked by a failed deployment, scheduled task, or synchronization issue.
Asset changes deserve special attention. If a stylesheet or JavaScript file keeps the same filename after deployment, visitors may receive an older browser-cached copy. Versioned filenames or cache-busting version parameters are typically safer than asking all visitors to clear their browser cache.
Why a cache hit does not always mean the website is fast
A cache hit only says that one layer served a stored item. It does not confirm that the page is lightweight, usable, or fast for every user. A cached document can still request oversized images, load many third-party scripts, shift layout while fonts load, or execute expensive JavaScript on the device.
Likewise, a site can look fast on its most cacheable pages while the pages that generate revenue remain uncached and slow. Test representative journeys: landing page, category or search page, product or service detail page, form submission, login, cart, checkout, and account pages where relevant. If the origin struggles under real traffic, it may eventually return errors rather than merely slow responses. For that distinction, review 503 Service Unavailable Error: What It Means for a Live Website.
Cache rules that need extra caution
Do not apply full-page caching blindly to pages that vary by user, session, location, currency, device, or consent state. Common risk areas include carts, checkout, customer accounts, admin screens, preview URLs, password-protected content, and pages with one-time security tokens.
Also review query-string handling and cookies. If a cache ignores a cookie that changes pricing or logged-in state, it may serve the wrong response. If it treats every harmless query parameter as a separate page, the cache may fragment into many low-value entries and provide little benefit. The right behaviour depends on the application, so use documented rules from the hosting, CDN, or cache provider rather than copied settings from an unrelated site.
Want a faster website?
Use website cache troubleshooting to establish a baseline before making broad changes. Test a public page and an important dynamic page; note response time, cache status, freshness after an edit, and behaviour for logged-in versus logged-out visitors. Then fix the specific bottleneck you can demonstrate.
If caching is working but uncached requests are slow, investigate server resources, PHP execution, database queries, and external dependencies. If cached requests are slow, look at page weight and frontend delivery. If content is stale, trace invalidation from the application through the host or CDN to the visitor’s browser. This evidence-led approach improves performance without putting critical dynamic flows at risk.
Website cache troubleshooting checklist
- Identify the exact URL, visitor type, and expected content.
- Classify the page as public, dynamic, or personalized.
- Test in a private session and from a second device or network.
- Compare first and repeat loads, including server response time.
- Check which cache layer reports a hit, miss, or bypass.
- Trace stale content from browser cache through CDN, host, and application cache.
- Confirm that carts, logins, account pages, and transactional flows are excluded where necessary.
- Measure the important uncached journeys, not only the homepage.