
When pages take too long to load, it is tempting to blame “the database.” Sometimes that is correct. A query may scan far more rows than expected, wait on a locked table, or run repeatedly during one request. Just as often, however, the database is only where the delay becomes visible while the real cause is inefficient PHP code, missing caching, limited server resources, or traffic that exceeds the current setup.
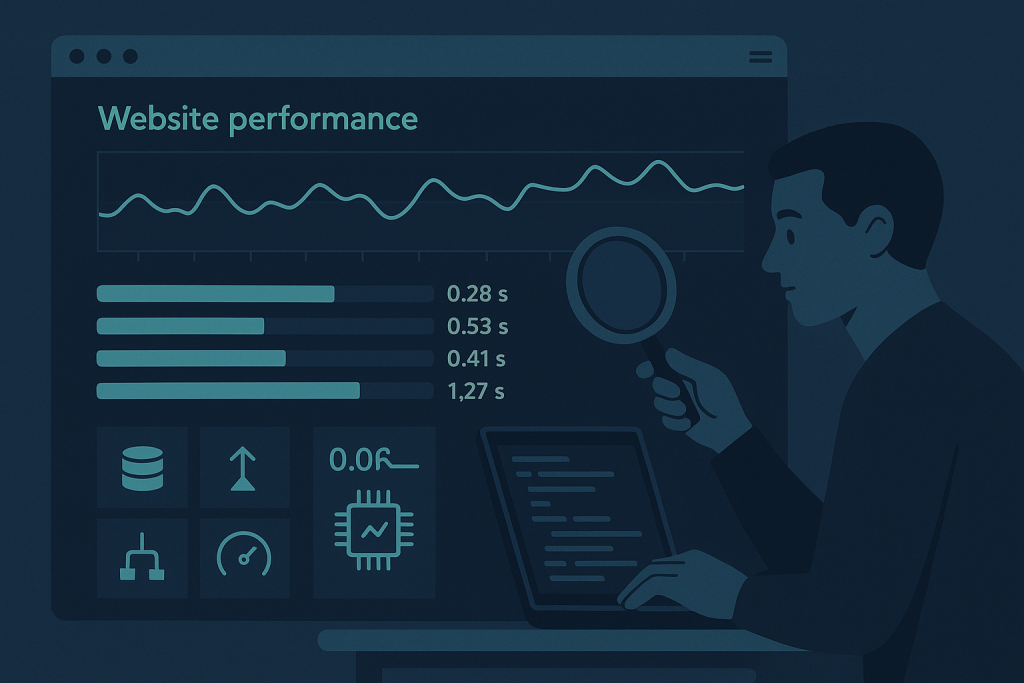
Slow website database query troubleshooting is the process of measuring what happens during a request and proving whether database work is the bottleneck. It is not a matter of installing a generic optimization plugin or adding indexes at random. The objective is to identify the slow request, find the costly query or wait within it, make the smallest appropriate change, and measure again.
If a site has broader loading and responsiveness problems, this database-focused process fits within website performance optimization. The database is one layer of the request path, alongside browser assets, caching, PHP execution, and server capacity.
How to tell whether the database is actually slowing the website
A slow page does not automatically mean a slow query. Start by separating the time spent in each layer. A request can be delayed before it reaches the database, while PHP is preparing data, while it waits for a remote API, or while the browser downloads large files.
Database involvement becomes more likely when you see a consistent pattern such as:
- Pages are slow mainly when logged-in users, search, filtering, reporting, or account history is involved.
- The problem worsens as the number of products, orders, posts, users, or records grows.
- A specific URL is slow while simple pages remain quick.
- Response times rise sharply during periods of concurrent traffic.
- Database CPU, connections, disk activity, or slow-query logs show activity that matches the slow periods.
- A request profiler shows a large share of request time in database calls.
These clues are useful, but evidence matters more than symptoms. A homepage that loads slowly may issue many queries without those queries being individually expensive. Conversely, a single poorly structured query can make an admin report or filtered catalogue unusable.
Capture a baseline before changing anything
First, record a small, repeatable baseline. Test the same important URL several times under similar conditions. Note the response time, time to first byte where available, whether the response is cached, the user state involved, and the approximate time of the test. For dynamic pages, test both an ordinary visitor flow and the affected logged-in or checkout flow if relevant.
Then collect evidence from the application and database layers. Depending on the stack and the access available, useful sources include:
- Application performance monitoring or request traces showing time per database call.
- Database slow-query logs, sampled carefully and reviewed securely.
- Database process or activity views that reveal currently running queries and waits.
- Server monitoring for CPU saturation, memory pressure, disk latency, and connection counts.
- Application logs that associate a slow request with a route, error, timeout, or request ID.
A baseline prevents misleading conclusions. If a change reduces query duration from 300 milliseconds to 30 milliseconds but the page still takes three seconds because it waits on an external service, the database change was valid but not the main user-facing fix.
Find the slow request before inspecting every query
Begin with a user-visible action: a product search, category filter, dashboard report, account page, cart update, or API endpoint. Ask which route is slow, who experiences it, whether it is always slow or only slow under load, and whether the result varies by data set.
Next, compare that request with a known-fast equivalent. For example, a filtered product archive may be slow while an unfiltered category page is fast. That difference narrows the investigation. A report that slows only for a large date range suggests different query behavior than a page that is slow at every size.
Do not start by reviewing every database table or changing global database settings. That creates noise and may increase risk on a live site. The best starting point is the specific request that has a clear business impact.
Common database query bottlenecks
Missing or unsuitable indexes
An index can help the database locate relevant rows without reading a large portion of a table. But an index only helps when it matches the filtering, joining, and sorting pattern of the real query. A query that filters by one column and sorts by another may need a different approach than a query that filters on a single ID.
Adding an index without examining the query plan can waste space and slow writes. Review the query structure and execution plan first. Look for large scans, expensive sorts, or joins that process substantially more rows than the final result requires.
Too many queries per request
A page can become slow even when no individual query looks disastrous. This commonly happens when code loads related records one at a time in a loop. For example, a list of 100 items may cause 100 additional lookups for related data. The cumulative latency becomes significant, particularly when the database is remote or busy.
The remedy is usually to change how the application retrieves data: fetch required relationships in a controlled batch, preload known data, or redesign the page so it does not request unnecessary details. This is an application-level fix, not merely a database-tuning task.
Expensive searches, filters, and sorts
Search pages and reporting screens often combine flexible filters, partial text matching, multiple joins, and sorting. Those requirements can become costly as data grows. A query may be acceptable with hundreds of records and become slow with hundreds of thousands.
Useful fixes may include narrowing the default date range, paginating results, limiting selectable sort options, using a search system designed for the required search behavior, or creating an appropriate index. The right choice depends on the actual user requirement. Returning every matching row is rarely necessary for a usable interface.
Lock waits and contention
Not all database delay is execution time. A query can be quick in isolation but wait because another transaction holds a lock. This may appear during inventory updates, order processing, imports, scheduled jobs, or bulk edits. Under load, several requests may contend for the same records.
Investigate the waiting query and the transaction blocking it. Long transactions, unnecessary writes, broad updates, and background jobs running at busy times are common contributors. Treat lock contention carefully: restarting services may hide the immediate symptom without correcting the workflow that created the waits.
Connection and resource limits
If requests wait for an available database connection, the issue may be connection management or database capacity rather than a single bad query. Similarly, high disk latency or sustained CPU pressure can slow otherwise reasonable queries. Query optimization and hosting capacity should be assessed together when the issue appears mainly during peaks.
At the severe end, overloaded resources can contribute to failed or unavailable requests. If visitors are receiving failures rather than merely slow pages, review the guidance on 503 Service Unavailable errors on a live website alongside the performance investigation.
Use query plans to test assumptions
A query plan explains how the database intends to obtain the result. It can reveal whether an index is used, how many rows may be examined, whether a sort is needed, and how joins are ordered. It does not replace real timing, but it helps explain why a query behaves poorly.
Review plans with the exact query shape and realistic parameters where possible. A plan for a rare filter value may differ from one for a common value. Also check whether the slow behavior is caused by fetching an excessive number of rows, selecting unnecessary columns, or performing calculations that should not occur for every request.
On production, avoid experiments that could run large, unbounded queries or lock busy tables. Use a staging environment for structural testing when it accurately represents the data and workload. When production evidence is necessary, keep observations narrow and reversible.
Validate the fix with the same test
After a change, repeat the original baseline test. Compare database time, total server response time, error rate, and behavior under the affected workflow. Confirm that the result is still correct: a faster report that omits records is not a successful optimization.
Also consider side effects. An added index can affect write performance and storage. A caching change can make data stale. A revised query may alter pagination or sort order. Validation should include normal user actions, high-value transactions, and any background jobs that touch the same data.
What not to do during slow website database query troubleshooting
- Do not delete database records, rebuild tables, or change live schema settings without a backup and a clear reason.
- Do not add several indexes at once; you will not know which change mattered.
- Do not assume caching fixes every database issue. It may reduce load while leaving slow uncached and logged-in flows unresolved.
- Do not judge a change only by one browser test. Compare server-side timing and the original slow workflow.
- Do not expose query logs, customer data, credentials, or full database exports while seeking help.
When to get technical help
Get help promptly when slow pages affect checkout, account access, order handling, lead generation, or a high-traffic campaign. It is also sensible to involve a developer when the evidence points to custom queries, recurring lock waits, database connection exhaustion, or a change that requires schema work. A careful investigation can distinguish a query problem from a wider capacity or application issue before a risky change is made.
Want a faster website?
Start with a repeatable example of the slow page and collect enough timing evidence to identify the affected layer. If database work is part of the problem, focus on the exact request, query pattern, wait, or resource limit rather than applying generic fixes. That produces a safer path to a faster, more reliable site.