
A WordPress debug log can turn a vague problem—such as a blank page, failed form, broken admin screen, or missing feature—into a useful technical clue. WordPress often hides PHP errors from visitors for security and presentation reasons. That is usually the right default, but it can make troubleshooting difficult when something stops working.
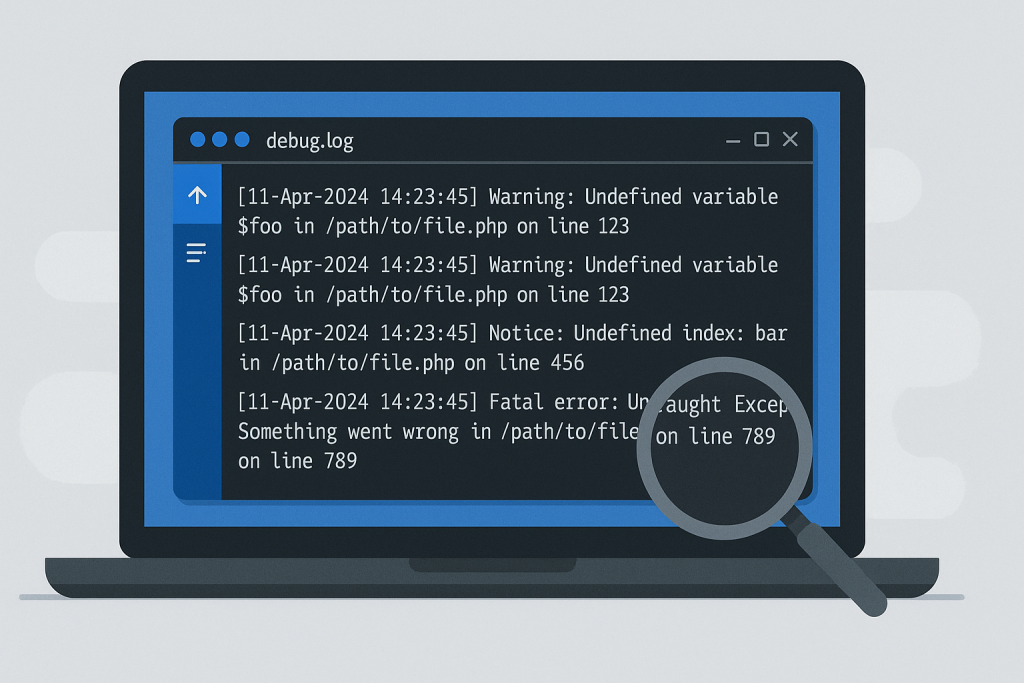
A debug log records errors, warnings, and notices generated while WordPress runs. It does not fix a problem by itself. It helps identify where to investigate: a plugin file, theme function, custom snippet, server setting, or integration. If you have a live issue that needs direct diagnosis and repair, see WordPress Bug Fixing.
What is the WordPress debug log?
The WordPress debug log is usually a text file named debug.log. When logging is enabled, WordPress writes relevant PHP messages to that file. A typical entry may include a date and time, the type of message, a short description, and a file path with a line number.
For example, an entry might indicate that a function is missing in a plugin file, that a custom theme function received unexpected data, or that a deprecated function is being used. The exact message matters. “There is an error” is not enough to identify the cause; the log can provide the detail needed to form a sensible next step.
In many standard installations, the file is located here:
/wp-content/debug.log
That location is common, not guaranteed. Hosting setups, security plugins, and custom WordPress constants can change where logs are written.
When should you use a WordPress debug log?
Use logging when the problem is reproducible and you need more information than the browser or WordPress admin provides. Common examples include:
- A page displays incorrectly, but no visible error appears.
- Saving a post, updating a setting, or submitting a form fails.
- A shortcode, block, widget, or custom feature no longer works.
- An admin request returns an unexpected error.
- A plugin integration works on one page but fails on another.
- A custom theme or code snippet appears related to the failure.
A log is most useful when you can reproduce the issue in a controlled way. Enable logging, perform the single action that causes the problem, then inspect the newest entries. This is far more useful than generating pages of unrelated messages by browsing the site at random.
How to enable WordPress debug logging safely
Before editing any configuration file, create a backup or use a staging environment where possible. On a production site, the goal is to collect evidence with minimal disruption—not to expose technical details to the public.
Open the site’s wp-config.php file, normally found in the WordPress root directory. Look for an existing WP_DEBUG setting. Add or update the following lines before the comment that says “That’s all, stop editing!”:
define( ‘WP_DEBUG’, true );
define( ‘WP_DEBUG_LOG’, true );
define( ‘WP_DEBUG_DISPLAY’, false );
@ini_set( ‘display_errors’, 0 );
Each setting has a different purpose:
- WP_DEBUG tells WordPress to enable debugging behavior.
- WP_DEBUG_LOG records messages in the debug log.
- WP_DEBUG_DISPLAY prevents those messages from being printed on public pages.
- display_errors provides an additional safeguard on some server configurations.
Do not add duplicate definitions. If the constants already exist, change the existing values instead. Duplicate or misplaced configuration lines can create confusion and, in some cases, lead to further errors.
How to find the debug.log file
After saving the configuration change, reproduce the issue once. Then access your files through your hosting control panel’s file manager, SFTP, or another approved file-access method. Check:
/wp-content/debug.log
If the file does not exist, that does not automatically mean logging failed. The action may not have triggered a PHP-level message, the server may be writing errors to its own log, or permissions may prevent WordPress from creating the file. Some managed hosts also provide an error-log viewer in their dashboard.
Check the file’s modification time and look at the entries nearest the time you reproduced the fault. Older entries may describe unrelated issues that were already present.
How to read a WordPress debug log without jumping to conclusions
Focus on the newest entries first. A useful entry often contains four pieces of information:
- Error type: for example, fatal error, warning, notice, or deprecated message.
- Message: what WordPress or PHP expected and what it encountered.
- File path: the plugin, theme, WordPress core, or custom file involved.
- Line number: the approximate location in that file.
A fatal error deserves prompt attention because it can stop a request completely. Warnings and notices may not break the site immediately, but they can still reveal poor compatibility, bad assumptions in custom code, or a future failure risk. Deprecated messages generally mean code relies on an older method that may need updating; they are clues, not proof that the message is the direct cause of the visible issue.
File paths are especially helpful, but they should be interpreted carefully. If an error references a plugin, that plugin may be the source of the bug, or it may simply be the place where another component’s bad data becomes visible. The last file named is not always the true root cause.
A safer process for collecting useful evidence
- Record the exact symptom, URL or admin screen, and the action that triggers it.
- Note recent relevant changes, such as configuration edits, new code, or changes to connected services.
- Enable logging with public error display disabled.
- Reproduce only the affected action once or twice.
- Copy the newest relevant entries, including a few lines before and after the error if available.
- Disable logging again when the investigation is complete.
Avoid treating every warning as an instruction to edit a file. Randomly changing plugin code, deleting files, or disabling several components at once makes it harder to learn what actually happened. It may also replace a recoverable problem with a wider one.
Logs can contain more information than expected. Depending on the site and error, they may expose full server paths, email addresses, request data, plugin settings, tokens, or other sensitive details. Never post an entire log file publicly without reviewing it first.
Likewise, do not leave debugging enabled indefinitely on a live site. Continuous logging can create a large file, consume storage, and retain details you do not need. Once you have collected the relevant entries, switch the settings back:
define( ‘WP_DEBUG’, false );
define( ‘WP_DEBUG_LOG’, false );
define( ‘WP_DEBUG_DISPLAY’, false );
If a debug log was created during testing, consider downloading the relevant portion for your records and removing or securing the file according to your site’s operational practices.
When a log points to an urgent issue
Prioritize the issue if visitors cannot access essential pages, administrators are locked out during a live operational need, or revenue-critical actions have stopped working. Repeated fatal errors, database connection failures, and errors affecting login, checkout, or core site functions should not be left to accumulate while you test broad changes on production.
Where the impact is immediate, use emergency website bug fixing rather than continuing a long trial-and-error process. A concise description of the symptom, the time it began, the steps to reproduce it, and the relevant log excerpt makes diagnosis more efficient.
Need help with a WordPress bug?
A WordPress debug log is valuable evidence, but it is only one part of troubleshooting. The error may involve several layers, including plugin behavior, theme code, server configuration, cached assets, database state, or a third-party service. If you have the error details but need help isolating the root cause and applying a safe fix, provide the symptom and the relevant log excerpt when requesting support.
Frequently asked questions
Does enabling the WordPress debug log show errors to visitors?
It can if debugging is configured carelessly. Set WP_DEBUG_DISPLAY to false and keep server-side error display disabled so messages are written to the log rather than shown on the page.
Why is there no debug.log file?
The affected action may not generate a logged PHP message, logging may not be enabled correctly, file permissions may interfere, or your host may write errors to a separate server log. Check the configuration first, then consult the hosting error-log location if necessary.
Can I delete debug.log?
After saving any entries needed for diagnosis, the log can generally be removed when debugging is disabled. WordPress may create a new file later if logging is enabled again and it has permission to write to the directory.
Is a warning always the cause of my WordPress issue?
No. Warnings can be useful signals, but correlate the timestamp and message with the exact action that fails. The most relevant entry is usually the one produced when you reproduced the problem.